
Debugging Visual Basic Applications
Visual Basic used to be, by far, the most widely used development language in the programming universe. It was the development environment that took Microsoft Windows (and Microsoft themselves) to complete market dominance. It was the simplicity of the language and the ease in creating applications that drove this success, and the power of the debugging tools were a major factor in this. Visual Basic debugging tools were the best in class, and even now, they are as good as any debuggers out there. By the end of this tutorial you will understand how to debug in Visual Basic, what tools are provided and the tutorial provides helpful tips on getting the most out of the Visual Basic debugging environment.
Before I developed in Visual Basic, debugging was a major chore. Every application has bugs and tracing those bugs was a real laborious painstaking task. I’m not saying that fixing bugs in Visual Basic s any easier, but finding the bugs with the tools available is much easier. As any developer knows, finding the bug is half the battle! Debugging in all VB.NET editions such as Visual Studio 2010, 2013 or Visual Studio Express is essentially the same process. Conceptually the process and the tools provided are the same.
Out of the box, Visual Basic has a debug tools:
- Intellisense
- Breakpoints
- Command Window
- Watch Window
- Locals Window
- Call Stack
Let’s look at each of these in turn
Intellisense
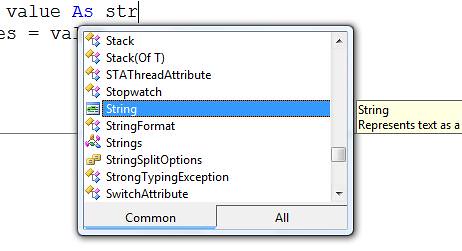
If you’re like me, you’re all fingers and thumbs when you type. It often looks like I’ve been typing with my forehead. Luckilly, Visual Basic, as I’m typing, will check if what I’ve typed is valid. As variable names are case sensitive, and I didn’t capitalise a letter, Visual Basic will capitalise it for me. If I mistypes a variable name or keyword, Visual Basic will tell me by putting a red line under the word. Visual Basic is essentially compiling as I type! It will warn me if variables aren’t used, if I try to assign a value of the wrong datatype. I don’t know how many hundreds of hours Intellisense has saved me with its syntax checking.
Perhaps the coolest thing about Intellisense is it’s ability to autocomplete. If I type a Functions name, it will list all the parameters I need to pass to that Function. If I type an objects name, it will list all the properties and methods associated with that object. Autocomplete is ubiquitous on smartphones these days but back then it was a revolution, the difference being, this autocomplete works!
Breakpoints
Perhaps the biggest revolution in debugging was and remains the ability to set a breakpoint on a line of code by pressing F9. When Visual Basic runs and encounters this line of code, it simply stops executing. You’re in Break Mode. Try it!
Open up the For Loop project, put a breakpoint on any line by pressing F9. Run your project. When Visual Basic breaks on that line, you can single step through your application, one line at a time. To execute that one line of code, press F10. Visual Basic will execute that one line, stopping at the next line. You can execute your entire application one line at a time, see what is called and see your variable values change one line at a time. Hover your mouse over a variable to see the value of that variable there and then. Genius!
Watch Window
When in Break Mode you’ll see this window by default in the bottom left of your screen
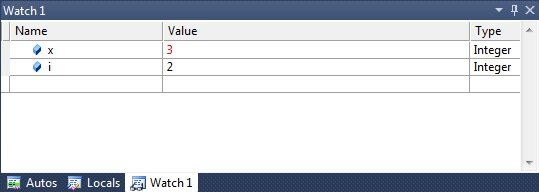
The Watch Window allows you to monitor variables or expressions e.g. variable = some value. You can set Visual Basic to just Watch the expression and quickly view the value when you reach a breakpoint. I have to be honest, I don’t use this feature so much but it’s lasted from Visual Basic 3 so there must be some people out there who like it.
Immediate Window
The Immediate Window is probably my favourite of all the debugging windows. When in break mode I can use call Functions (as shown above) or use the Debug Object to view the value of variables or expressions, and I can even change the value of variables at runtime. For example, I can use type Debug.Print variablename (Or ? variablename for shorthand) and Visual Basic will show me the value of that variable. I can enter a full expression such as Debug.Print variable > variable, and Visual Basic will tell me if that expression is true or false. Entering Debug.Print variable1/variable2 will give me the answer there and then. You can write code to check your code! I use this window all the time.
There is some overlap (and confusion) with the Command window. Essentially the Command window is a command line tool in itself. It is possible to e.g. search/replace text in a project or call any of the menu items, but for debugging purposes, just stick to the Immediate Window. That’s what it is for.
Call Stack

The Call Stack probably my second favourite window as it shows exactly what functions and subroutines have been called before that break point. You can see essentially the entire flow of execution of your program. You can see instantly if the program is behaving and executing as expected. Double clicking a routine name will take you directly to that routine (if it is your code) which can be extremely useful.
Locals Window
The Locals Window allows me to drill into all the variables and objects in scope at that time and view their values. This can be an invaluable timesaver if you can’t remember that variable name exactly. It also shows exactly what is in scope at that time.
So there you have it, you have a wealth of tools at your disposal. Use them wisely and they can be a terrific timesaver.